
Growth is Older Than You Think
PERSPECTIVE NO. 01 • CITA COLLECTIVE • AUGUST 2026
Where organizations misread the 50+ market, why those assumptions persist, and what the commercial cost can be.

KEY FINDINGS
Adults 50 and older are 36% of the U.S. population and account for 56% of U.S. consumer spending, generating an estimated $12.5 trillion in economic activity, or 43% of U.S. GDP (AARP and Economist Enterprise, The Longevity Economy® Outlook 2026). Adults over 60 represent 22.2% of the population but just 4.2% of models appearing in advertising (Campbell, Sands, McFerran and Mavrommatis, Journal of the Academy of Marketing Science, 2025). U.S. life expectancy reached 79 years in 2024, and a person who reaches 65 can now expect nearly another 20 years of life (CDC/NCHS, Mortality in the United States, 2024). The distance between economic weight and attention is not a representation problem but a growth problem, and it follows from three assumptions that no longer hold: that growth comes from youth, that "50+" describes a single market, and that products built for a shorter life still fit the one people are living.
The three-stage life was built for a shorter one
For generations, we have organized adulthood around three big chapters: learn, work, retire. It is such a familiar progression that it can feel almost biological. It isn't. It is a social and economic model built for a shorter life.
And while people's lives have changed, many of the systems built to understand and serve them have not. Marketers still disproportionately look younger when they look for growth. Research still collapses decades of later life into broad age bands. Products, services and messages are still designed around assumptions about when careers end, families change and needs emerge.
How much longer are Americans actually living?
U.S. life expectancy reached 79 years in 2024. More telling, someone who reaches 65 can now expect, on average, nearly another 20 years of life. That is not an epilogue. It is an additional adult chapter.
The instinct is to assume those extra years were simply added to the end. Retirement got longer. Everything before it stayed more or less the same.
But that isn't what happened.
Longer lives are changing the timing, order, overlap and meaning of nearly everything that comes before retirement, too.
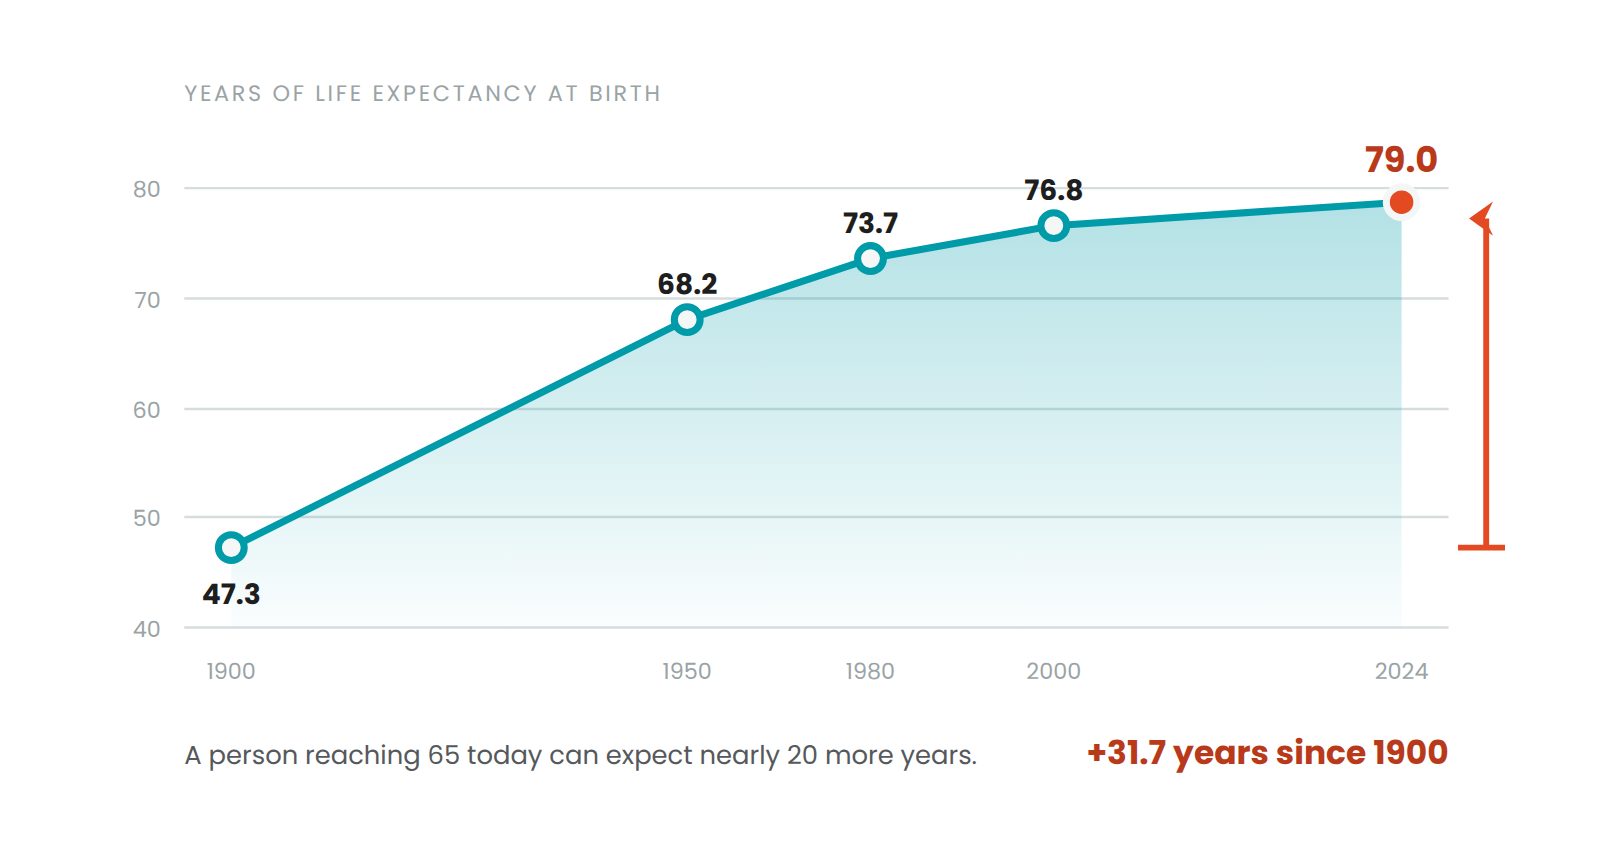
Figure 1. A century of added life. U.S. life expectancy at birth, total population, 1900 to 2024: 47.3 years in 1900, 68.2 in 1950, 73.7 in 1980, 76.8 in 2000, and 79.0 in 2024 — a gain of 31.7 years. Source: CDC/National Center for Health Statistics, Health, United States, 2017, Table 15 (1900–2000); CDC/NCHS, Mortality in the United States, 2024, Data Brief No. 548, January 2026.
The sequence broke
Look at when some of life's most familiar milestones now happen. The median first-time homebuyer in the United States is 40, an all-time high. At the same time, 62% of working Americans say caring for or financially supporting family members affects their ability to save for retirement. Households headed by someone 50 or older now provide roughly 72% of the financial support going to college students.
So consider what "middle age" can actually look like. A 58-year-old may be paying a mortgage, helping an adult child with college or housing, managing care for an aging parent, supporting a household, building retirement savings, and contemplating what comes next professionally. All at once.
That life bears very little resemblance to the orderly progression on which many of our financial models, consumer segments and brand assumptions were built.
Ipsos describes the underlying shift well: life events still tend to happen in clusters, but those clusters are increasingly happening later or outside the sequence we once expected. And it is happening at both ends of adulthood.
Milestones are arriving later at the start of adulthood
Among Americans ages 18 to 35, only 46% say they have moved out of their parents' home. Yet Ipsos' research suggests it would be a mistake to read that as a generation abandoning traditional aspirations. Most still expect things like independent living, full-time work, partnership and parenthood. The goals have not necessarily disappeared. The timeline has changed.
Careers no longer end on schedule
At the other end, work is stretching well beyond what we once considered a normal career span. Adults 50 and older now make up roughly a third of the U.S. labor force, and the share of workers 65 and older has nearly tripled over the past 25 years. Nearly 40% of Gen Xers say they either do not expect to fully retire or plan to continue working at least into their seventies.
But even that is not a simple story of everyone working longer. Some people leave work before they intended to. Others return after retiring. In AARP's 2026 Labor Force Pulse Survey, nearly one in four retirees said they felt they had retired too early, while 6% had returned to work from retirement within the previous six months.
Some people are extending careers. Others are leaving them unexpectedly. Some are stepping away, then stepping back in.
The stages did not simply move later. They became less reliable as stages.
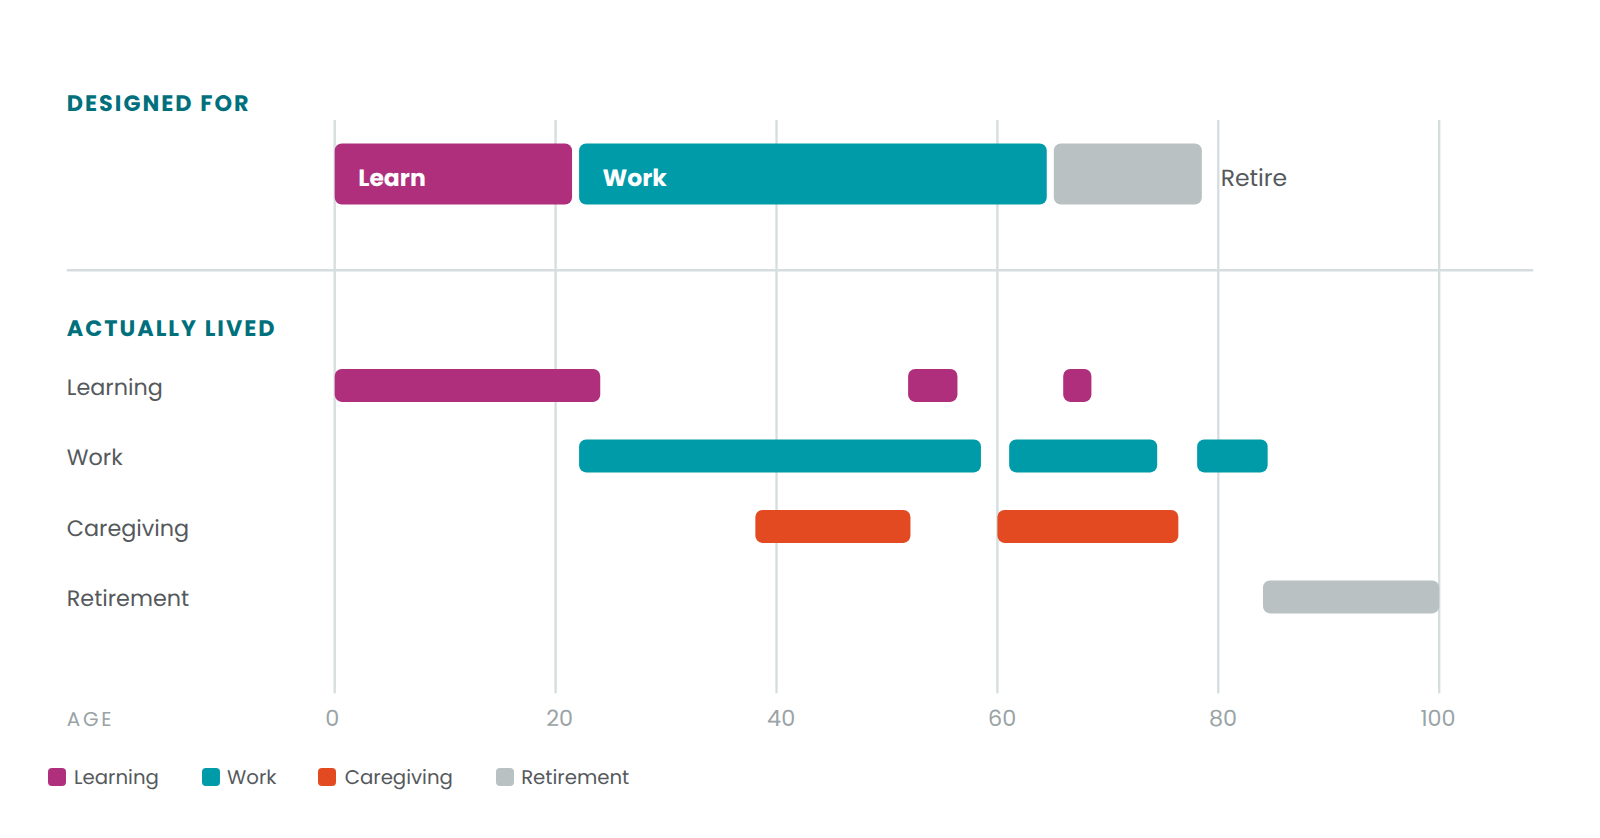
Figure 2. The model, and the life. Above: the three-stage life our segments, products and financial models were built around — learning to roughly age 22, work to roughly 65, retirement thereafter. Below: an illustrative contemporary path, in which learning recurs in a person's fifties and sixties, work is interrupted and resumed more than once, caregiving appears twice across midlife and later life, and retirement arrives later and occupies a smaller share of adulthood than the model assumes. Source: Illustrative. Constructed by CITA Collective from life-course patterns reported in the sources listed below.
Why is age a poor way to segment the 50+ market?
Our vocabulary for adulthood has not kept pace with the way people are actually living. What do we call the period after one career ends but before anything resembling retirement begins? What do we call someone simultaneously caring for a parent and financially supporting an adult child? What life stage describes starting a business at 61, returning to school at 66, forming a new household at 71, or leaving the workforce to provide care at 54 and reentering it at 59?
These aren't anomalies around the edges of the market. They are increasingly the market.
Yet organizations continue to rely heavily on age as a shortcut for understanding people. There is a practical reason for that: age is easy. It is available in virtually every research study, CRM system, media plan and consumer database. It creates clean segments, familiar benchmarks and simple ways to size an audience.
And once businesses have spent decades organizing people into brackets like 18–34, 35–49, 50–64 and 65+, those brackets can begin to look like meaningful descriptions of people rather than what they really are: useful administrative categories.
The problem isn't that age has no value. It does. Age can tell us something about biology, accumulated experience and probability. The problem is when convenience becomes explanation.
Consider two 60-year-olds. One is winding down a 35-year career and preparing to draw from savings. Another has just launched a consulting business and expects to work for another 15 years.
One has paid off a home and has no dependents. Another has a mortgage, a college-age child and a parent whose care she is helping manage.
Demographically, they may look remarkably similar. Strategically, they have almost nothing in common.
A 60-year-old is not a life stage. Nor is "50+" one coherent market. A 53-year-old changing careers and a 79-year-old falling in love may both sit inside the same target definition, but grouping five decades of adulthood together doesn't simplify the market. It distorts it.
And that distortion carries a commercial cost. Organizations can end up researching very different people as though they were alike, overlooking emerging needs, designing products for a life customers are no longer living and spending marketing dollars against audiences too broad to be truly useful.
Flattening the market doesn't just reduce precision. It can hide where growth is actually coming from.
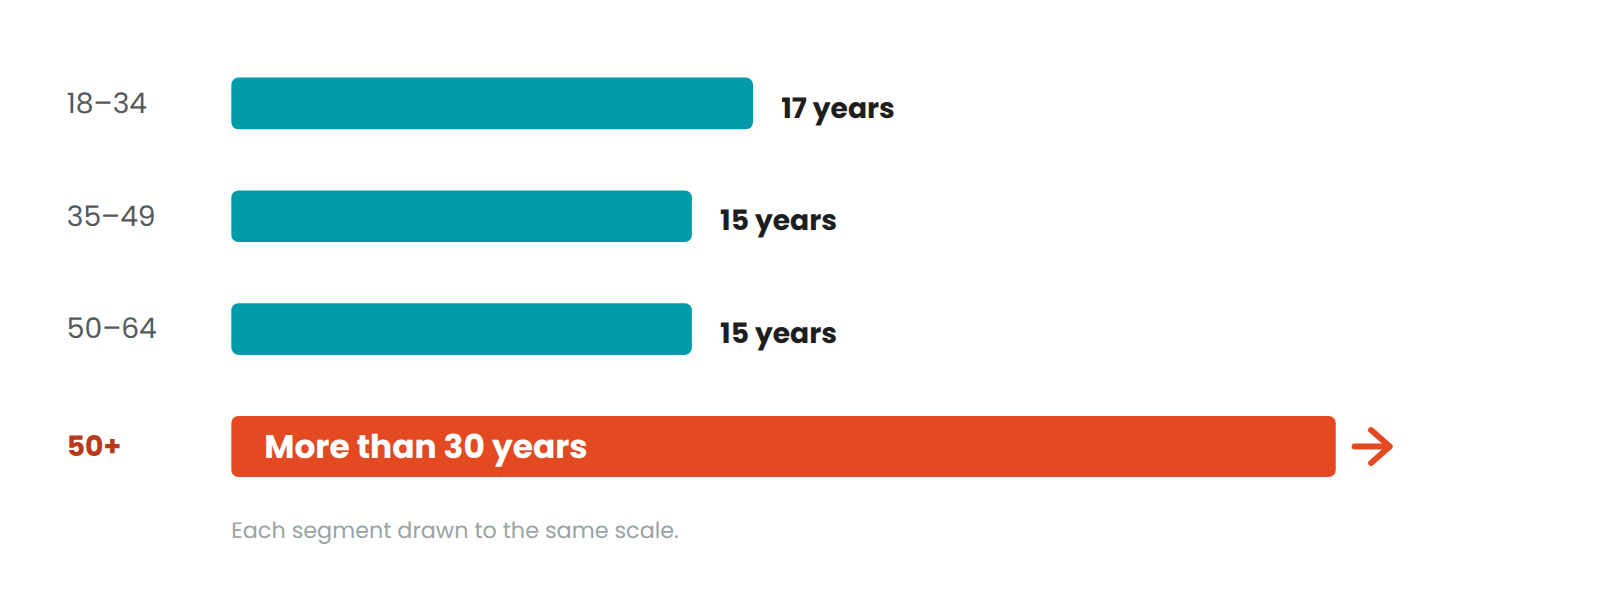
Figure 3. One of these is not like the others. Age span covered by common marketing segments: 18–34 spans 17 years; 35–49 spans 15 years; 50–64 spans 15 years; 50+ spans more than 30 years. 50+ is commonly used as an umbrella target rather than a mutually exclusive age bracket. Source: CITA Collective analysis of common age segments used in consumer research and media planning.
How big is the 50+ consumer market?
If this were a small market, those blind spots might be easier to dismiss. It isn't.
Adults 50 and older represented roughly 36% of the U.S. population in 2024, yet households headed by someone 50-plus accounted for 56% of consumer spending. Their broader economic activity generated an estimated $12.5 trillion, or 43% of U.S. GDP. By 2060, 50-plus households are projected to account for more than 61% of U.S. consumption.
Yet attention has not followed economic influence.
One analysis published in the Journal of the Academy of Marketing Science found that adults 60 and older represented 22.2% of the U.S. population but just 4.2% of models appearing in advertising.
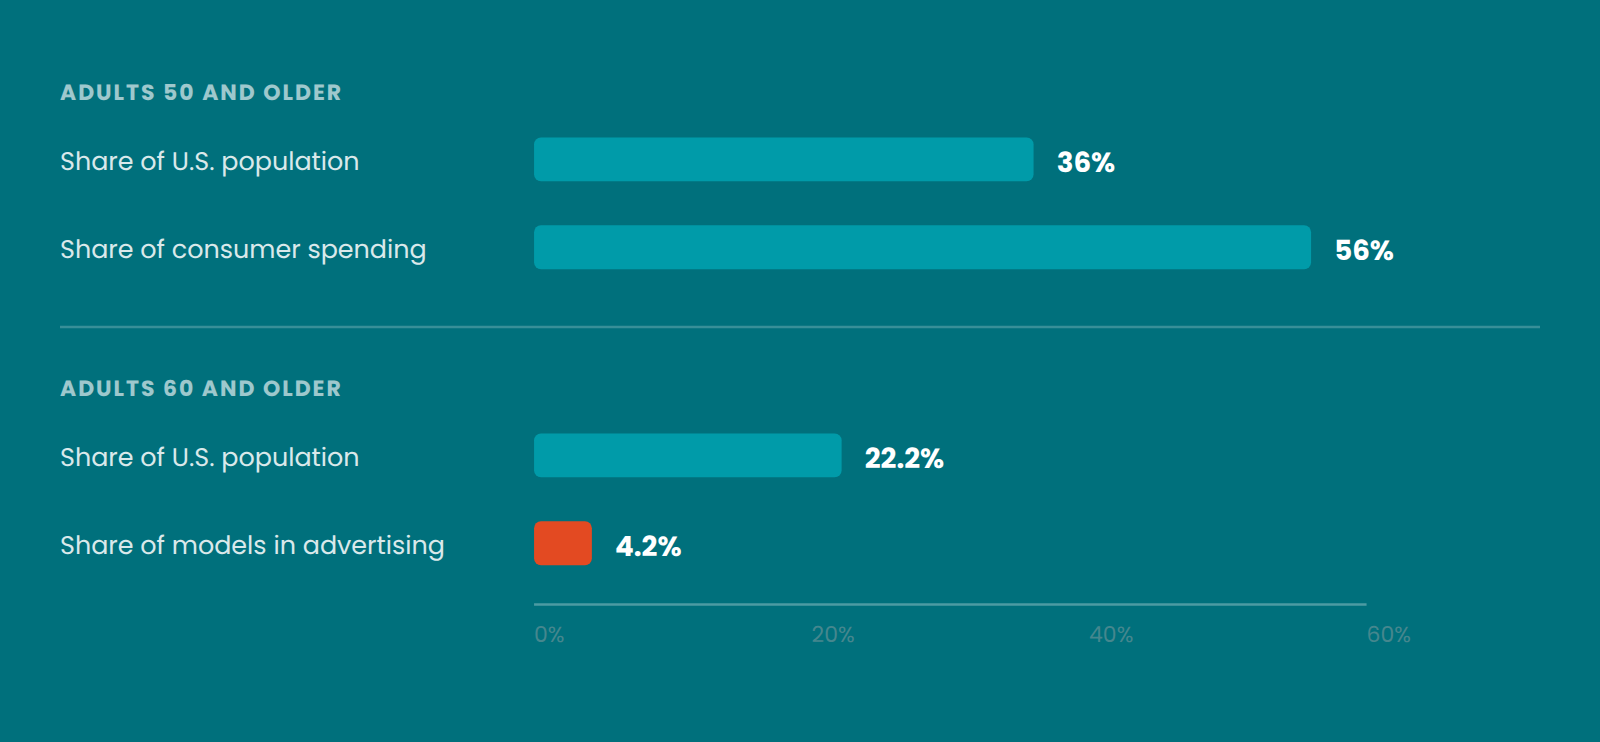
Figure 4. Economic weight and the attention it gets. Adults 50 and older are 36% of the U.S. population and 56% of consumer spending. Adults 60 and older are 22.2% of the U.S. population and 4.2% of models appearing in advertising. Spending outpaces population. Visibility falls far behind. Source: Population and spending, AARP and Economist Enterprise, The Longevity Economy® Outlook 2026. Advertising representation, Campbell, Sands, McFerran and Mavrommatis, Journal of the Academy of Marketing Science, 2025. The two pairs use different age thresholds, as reported by their sources.
That disconnect reveals something deeper than a representation problem. For decades, marketers have been conditioned to associate youth with the future and therefore with growth. The result is a tendency to invest disproportionate energy in acquiring younger consumers while treating people later in life primarily as existing customers to retain, rather than consumers whose needs, spending and lives are still changing.
But longer life creates new demand precisely because life keeps changing.
Where 50+ spending is growing fastest
Where 50-plus consumers are spending provides an early read on some of those shifts. Spending on communications and electronics among this population has increased 62% since 2018, faster than any other major category tracked in AARP's latest longevity research. Smartphone ownership among adults 50-plus climbed from 55% in 2016 to 90% in 2025, and adults in their seventies now surpass those ages 50 to 69 in tablet ownership.
This is not a population sitting outside technological change. Technology is increasingly part of how people work, connect, manage health, navigate the world and maintain independence as they live longer.
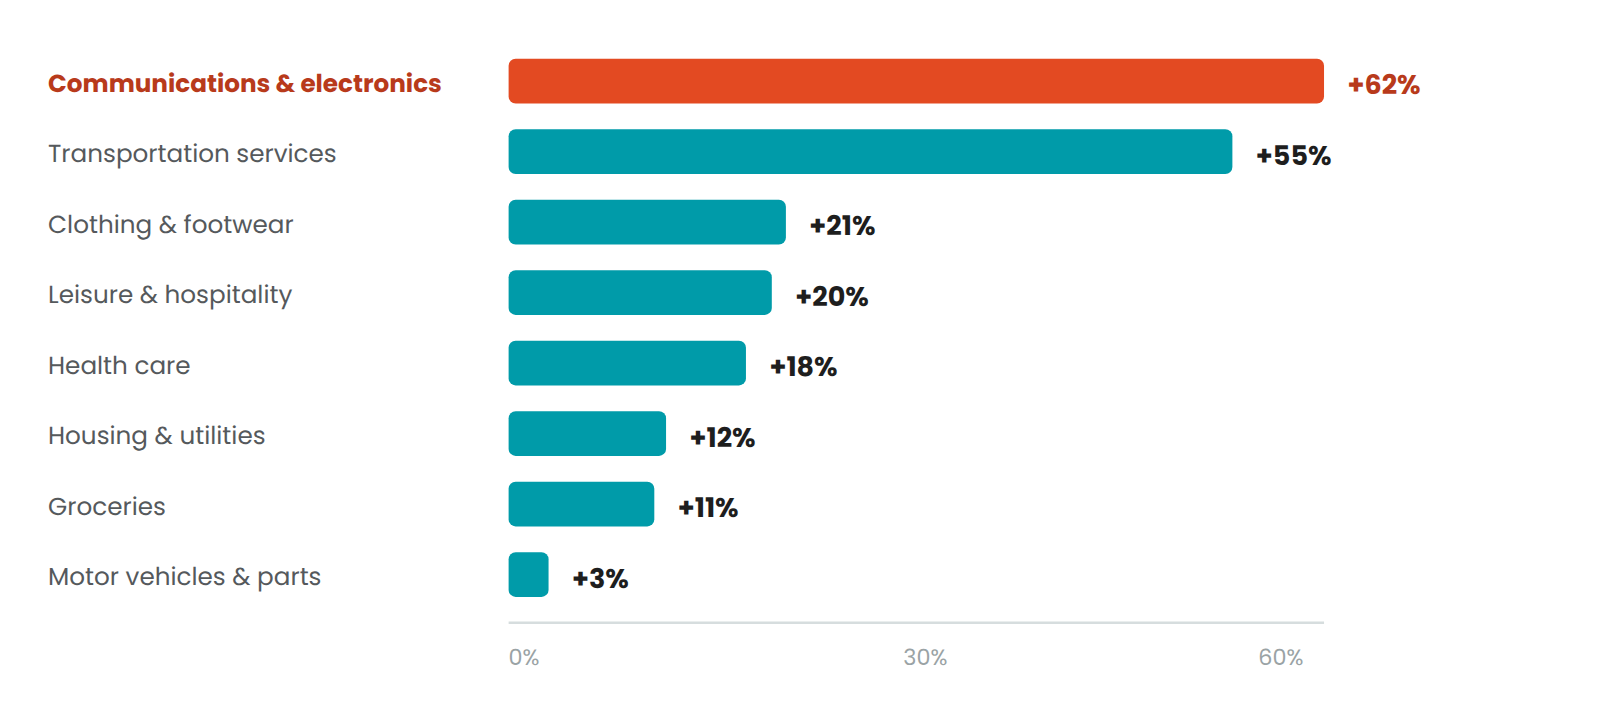
Figure 5. Where the money is already moving. Inflation-adjusted growth in spending by households headed by someone 50 or older, 2018 to 2024: communications and electronics, +62%; transportation services, +55%; clothing and footwear, +21%; leisure and hospitality, +20%; health care, +18%; housing and utilities, +12%; groceries, +11%; motor vehicles and parts, +3%. Source: AARP and Economist Enterprise, The Longevity Economy® Outlook 2026, June 2026.
Why aging in place reshapes demand across categories
Housing offers another signal. Three-quarters of adults 50 and older say they want to remain in their current homes as they age. That preference creates needs that cut across categories: home modification, delivery, mobility, safety, connected technology, healthcare, financial services and in-home support.
Seen one category at a time, each can look like a separate market trend. Seen together, they are something bigger.
Why are products still designed for a shorter life?
Many of the products, services and experiences surrounding adulthood were built around the same linear life model as our age segments.
What longer lives change for financial services
Financial planning has traditionally assumed a progression from earning and accumulation to retirement and drawdown. But what happens when those activities overlap? When someone is simultaneously working, saving, caregiving, spending and financing another generation?
What longer lives change for healthcare
Healthcare faces a related challenge from the other direction. Age can be relevant to health risk, but it cannot by itself explain how someone wants to live, how functionally independent they are, what responsibilities they carry or what kind of support would make their life easier.
The same gap runs through every category
The same issue extends far beyond those two industries.
Housing designed around the assumption that people will eventually relocate. Technology simplified because someone is "older." Travel experiences that equate later life with slowing down. Retail assortments built around outdated ideas of who purchases what. Messaging that portrays aging primarily through decline, nostalgia or retirement.
The problem is not simply one of representation. It is a design lag. Longer lives have changed the brief, but much of the market is still working from the old one.
And "design" here means more than the product itself. It includes how an organization designs its research, its segments, its customer journeys, its service model, its communications and its innovation pipeline.
If the assumptions going in are wrong, the consequences travel a long way downstream.
The growth question has changed
The opportunity here is not simply to "market better to older consumers." That framing is too small.
The bigger opportunity is to understand what longer lives are doing to everyone's path through adulthood, and what that means for the assumptions businesses make about when needs arise, who has them and how long they last.
It means looking beyond youth as the automatic source of future growth. It means resisting the temptation to collapse five decades of adulthood into one market. And it means questioning products, services and messages that were built around a life course people increasingly no longer follow.
Instead of asking only, How old is this person? we need to understand: What are they moving into? What are they moving out of? Who are they responsible for? What are they trying to build, preserve, solve or start again?
Those questions tell us much more about what someone may need next than their birth year alone.
The opportunity is not simply to pay more attention to older consumers.
It is to see them more clearly.
Longevity has not simply stretched the old map. It has made the map less useful.
And if the consumer journey through life has changed, businesses should be asking a much bigger question: how much of our segmentation, innovation and growth strategy is still built around the old one?
About CITA Collective
CITA Collective is a research and strategy practice dedicated exclusively to U.S. 50+ consumers. We find the truth about the 50+ consumer and help you act on it. Through research and strategy, we help create products, services, experiences and messages that reflect how people are actually living longer lives.
Greater possibilities for longer lives.
Sources
CDC/National Center for Health Statistics, Mortality in the United States, 2024, NCHS Data Brief No. 548, January 2026. Historical series from Health, United States, 2017, Table 15. — https://www.cdc.gov/nchs/products/databriefs/db548.htm
National Association of REALTORS®, 2025 Profile of Home Buyers and Sellers, November 2025. — https://www.nar.realtor/newsroom/first-time-home-buyer-share-falls-to-historic-low-of-21-median-age-rises-to-40
Goldman Sachs Asset Management, Retirement Survey & Insights Report 2025: New Economics of Retirement, October 2025. — https://am.gs.com/cms-assets/gsam-app/documents/insights/en/2025/am-retirement-survey-102025.pdf
AARP and Economist Enterprise, The Longevity Economy® Outlook 2026, June 2026. — https://www.aarp.org/pri/topics/work-finances-retirement/economics-aging/longevity-economy-outlook/
Ipsos, What happens to financial goals when traditional milestones shift?, August 2026. — https://www.ipsos.com/en-us/future/what-happens-financial-goals-when-traditional-milestones-shift
Ipsos, Are younger Americans redefining success or rescheduling it?, August 2026. — https://www.ipsos.com/en-us/future/are-younger-americans-redefining-success-or-rescheduling-it
Korn Ferry, Gen X on Retirement: "I'll Pass," August 19, 2026. — https://www.kornferry.com/insights/this-week-in-leadership/gen-x-on-retirement-ill-pass
AARP Research, Labor Force Pulse Survey, August 2026. — https://www.aarp.org/pri/topics/work-finances-retirement/employers-workforce/retirement-decisions-working-job-hunting/
AARP Research, 2026 Tech Trends and Adults 50-Plus, December 2025. — https://www.aarp.org/pri/topics/technology/internet-media-devices/2026-technology-trends-older-adults/
AARP, Home and Community Preferences Survey, 2024. — https://www.aarp.org/pri/topics/livable-communities/housing/2024-home-community-preferences/
Campbell, C., Sands, S., McFerran, B. and Mavrommatis, A., "Diversity representation in advertising," Journal of the Academy of Marketing Science, 53(2), 588–616 (2025). Published online December 26, 2023. — https://link.springer.com/article/10.1007/s11747-023-00994-8
© 2026 CITA Collective, LLC. All rights reserved. This paper may be quoted or cited with attribution to CITA Collective, Growth Is Older Than You Think, Perspective No. 01, August 2026. Data and figures drawn from third-party research remain the property of the cited sources and are reproduced here for commentary and analysis.